Optimize First Reaction
This short tutorial will teach you the basics of Yoneda Optimize, to get you started with using statistics and ML for reaction optimization!
Let’s take a look at Pd-catalyzed direct arylation of imidazole (published by the Doyle group).

As with most metal-catalyzed reactions, the reaction conditions are critical, and there are many parameters to consider.
Parameter |
Possible Values |
|---|---|
Ligand |
XPhos, PPh3, BrettPhos, MeCg-PPh |
Base |
KOAc, KOPiv, CsOAc, CsOPiv |
Solvent |
p-xylene, BuCN, BuOAc, DMAc |
Temperature |
90 °C, 105 °C, 120 °C |
Concentration |
57 mM, 100 mM, 153 mM |
Testing all possible combinations would require more than 500 experiments! Let’s see how Yoneda Optimize can find the best conditions much faster.
Running the App
Start by opening Yoneda Optimize, if this is your first time using the app, you will be greeted with a welcome screen and asked for your name and the company.

Specifying Parameters
First, we need to specify what reaction parameters we can change. In our case these include ligand, base, solvent, temperature, and concentration.
Start by clicking Reaction Parameters in the sidebar and fill in the table with optimization parameters.
Tip
To make sure you don’t lose your progress, you can save your project in the File menu, or using Ctrl+S.
For each parameter you need to specify its name (it is good practice to include units), whether the parameter is cathegorical or numeric, and the values that you want to test.
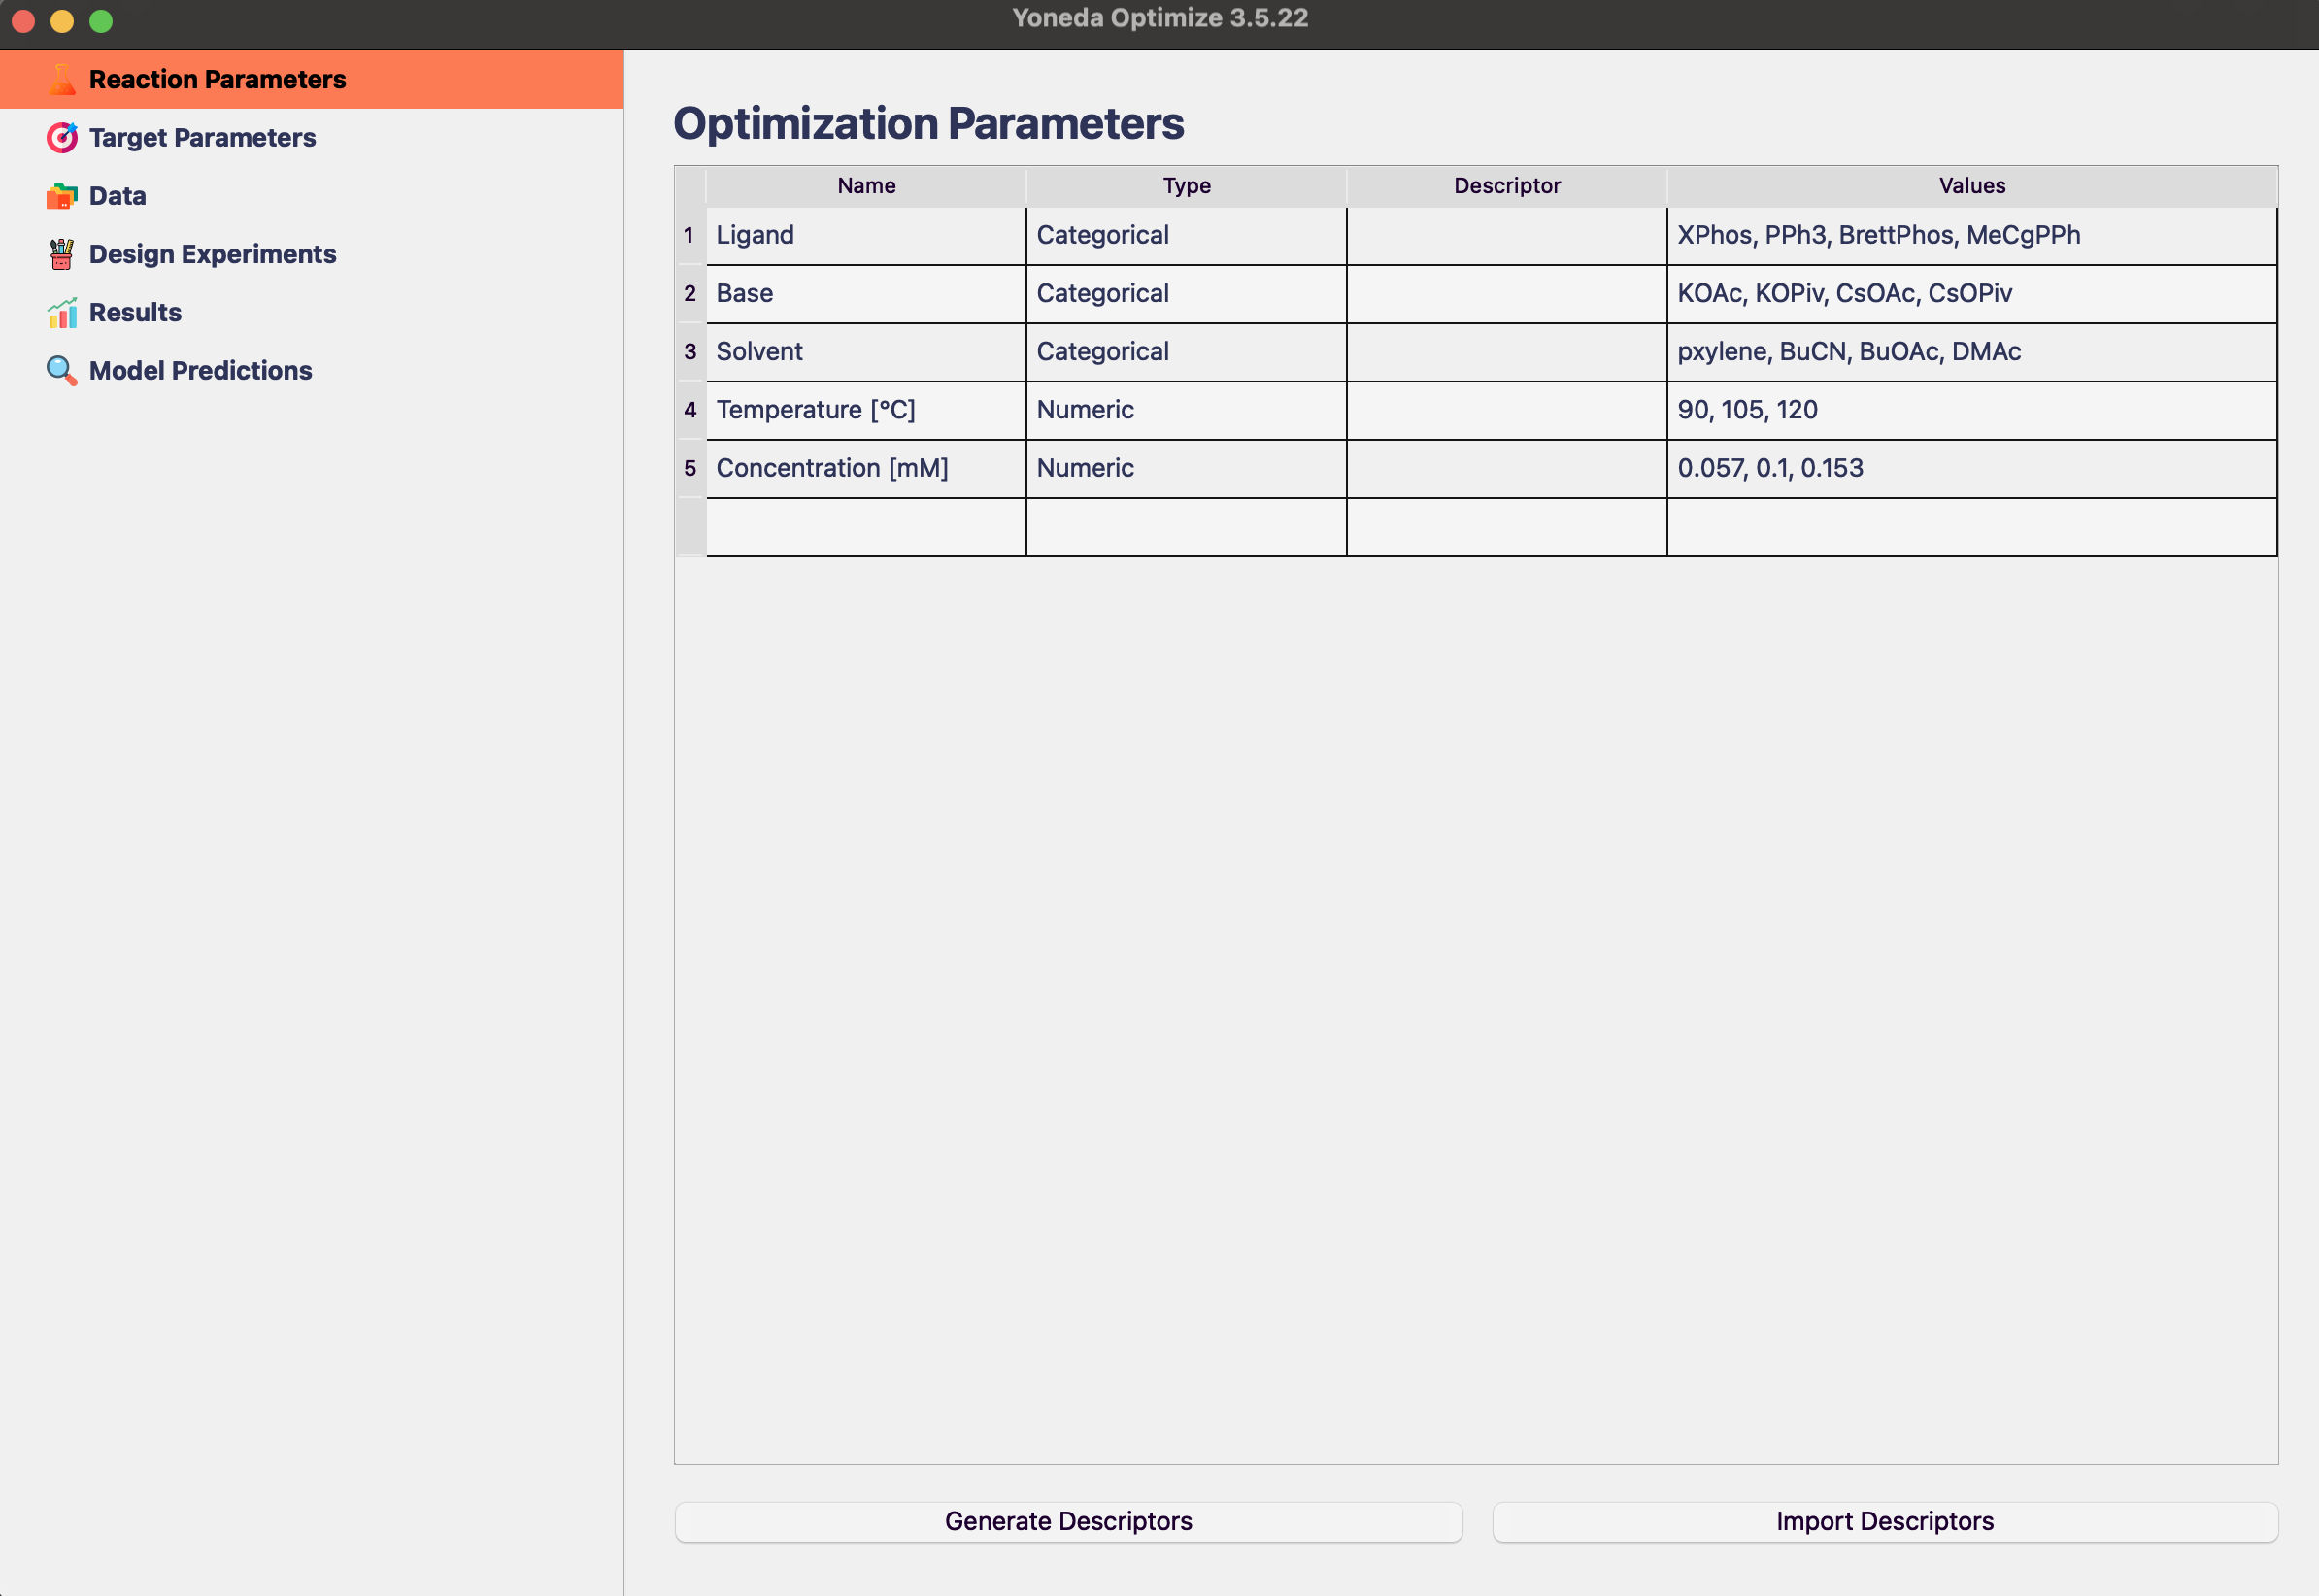
In future, you might also want to add chemical descriptors to help the algorithm understand structure-reactivity relationships, but this is not necessary.
Specifying Target
The next step is to specify what we want to optimize for. Click Target Parameters in the sidebar and fill in Yield as the target parameter. Also specify that we want to maximize the yield, and it can take values between 0 and 100.
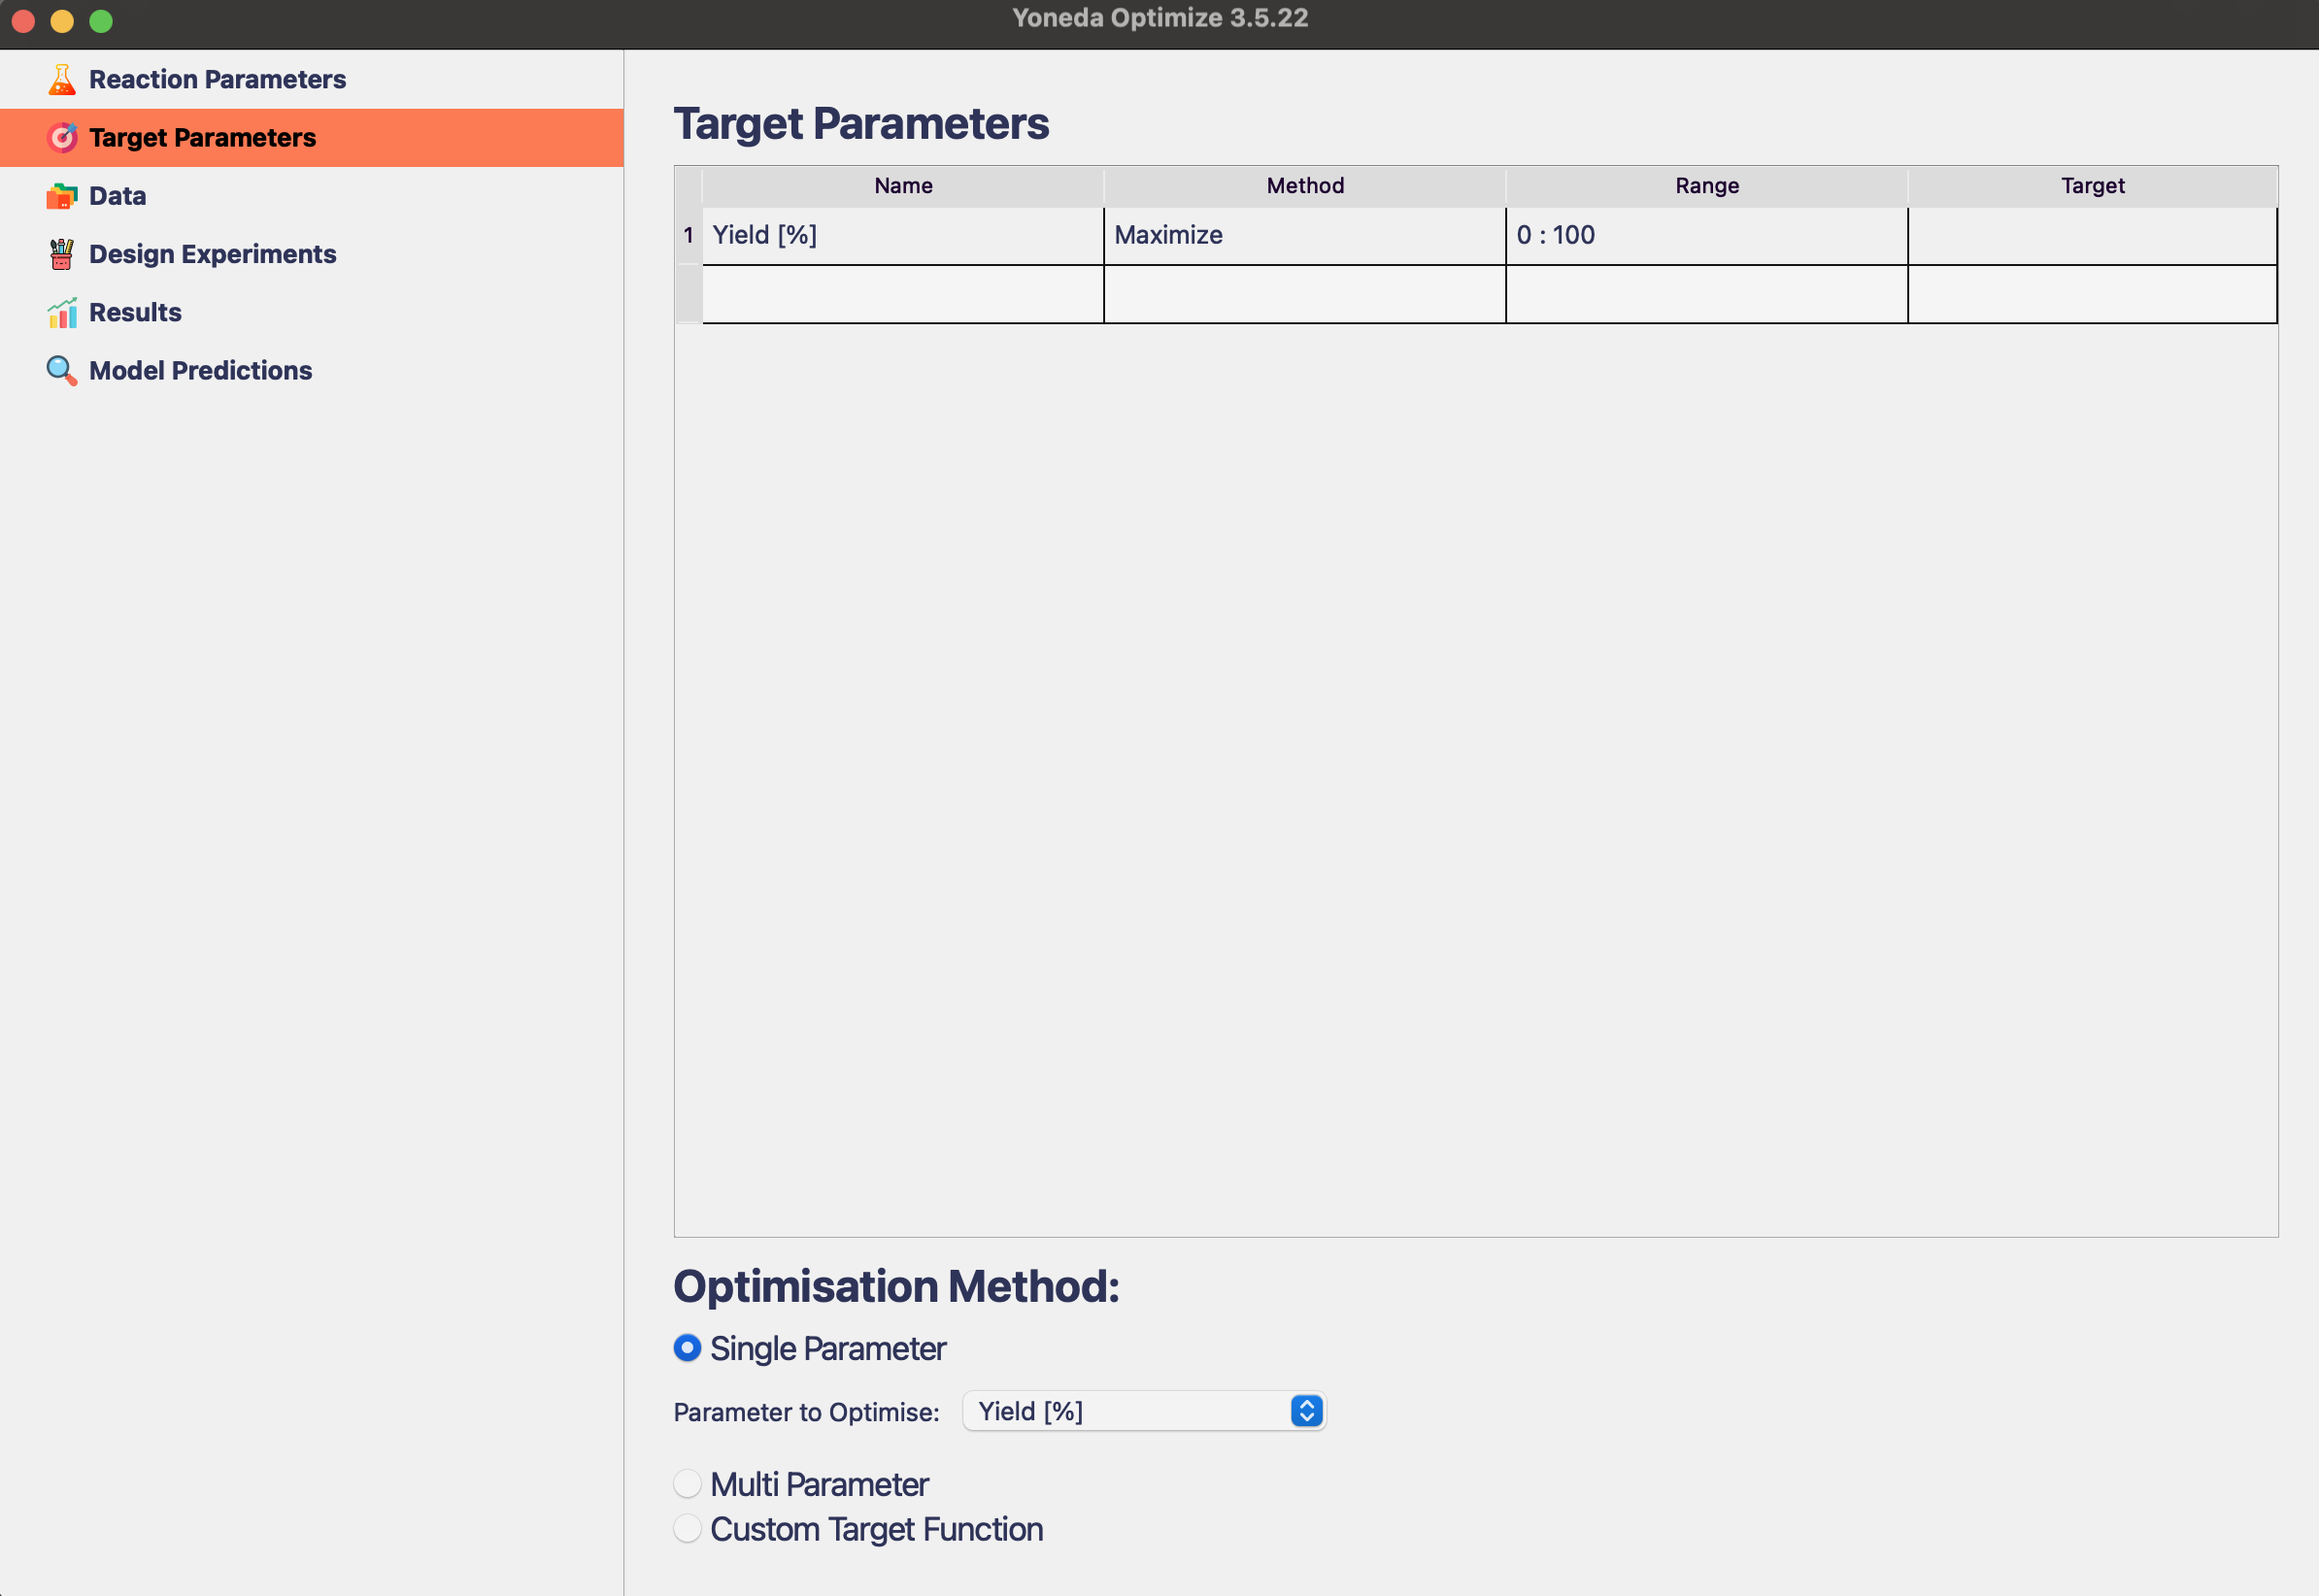
Make sure that Single Parameter is selected as the Optimization Method.
Tip
In this example case, we are maximizing the yield of the reaction, but it is also possible to optimize selectivity, cost, or any other metric. You can learn more in the Target Parameters section.
Running Design of Experiment
Now it’s finaly time to design some experiments! Click Design Experiments in the sidebar.
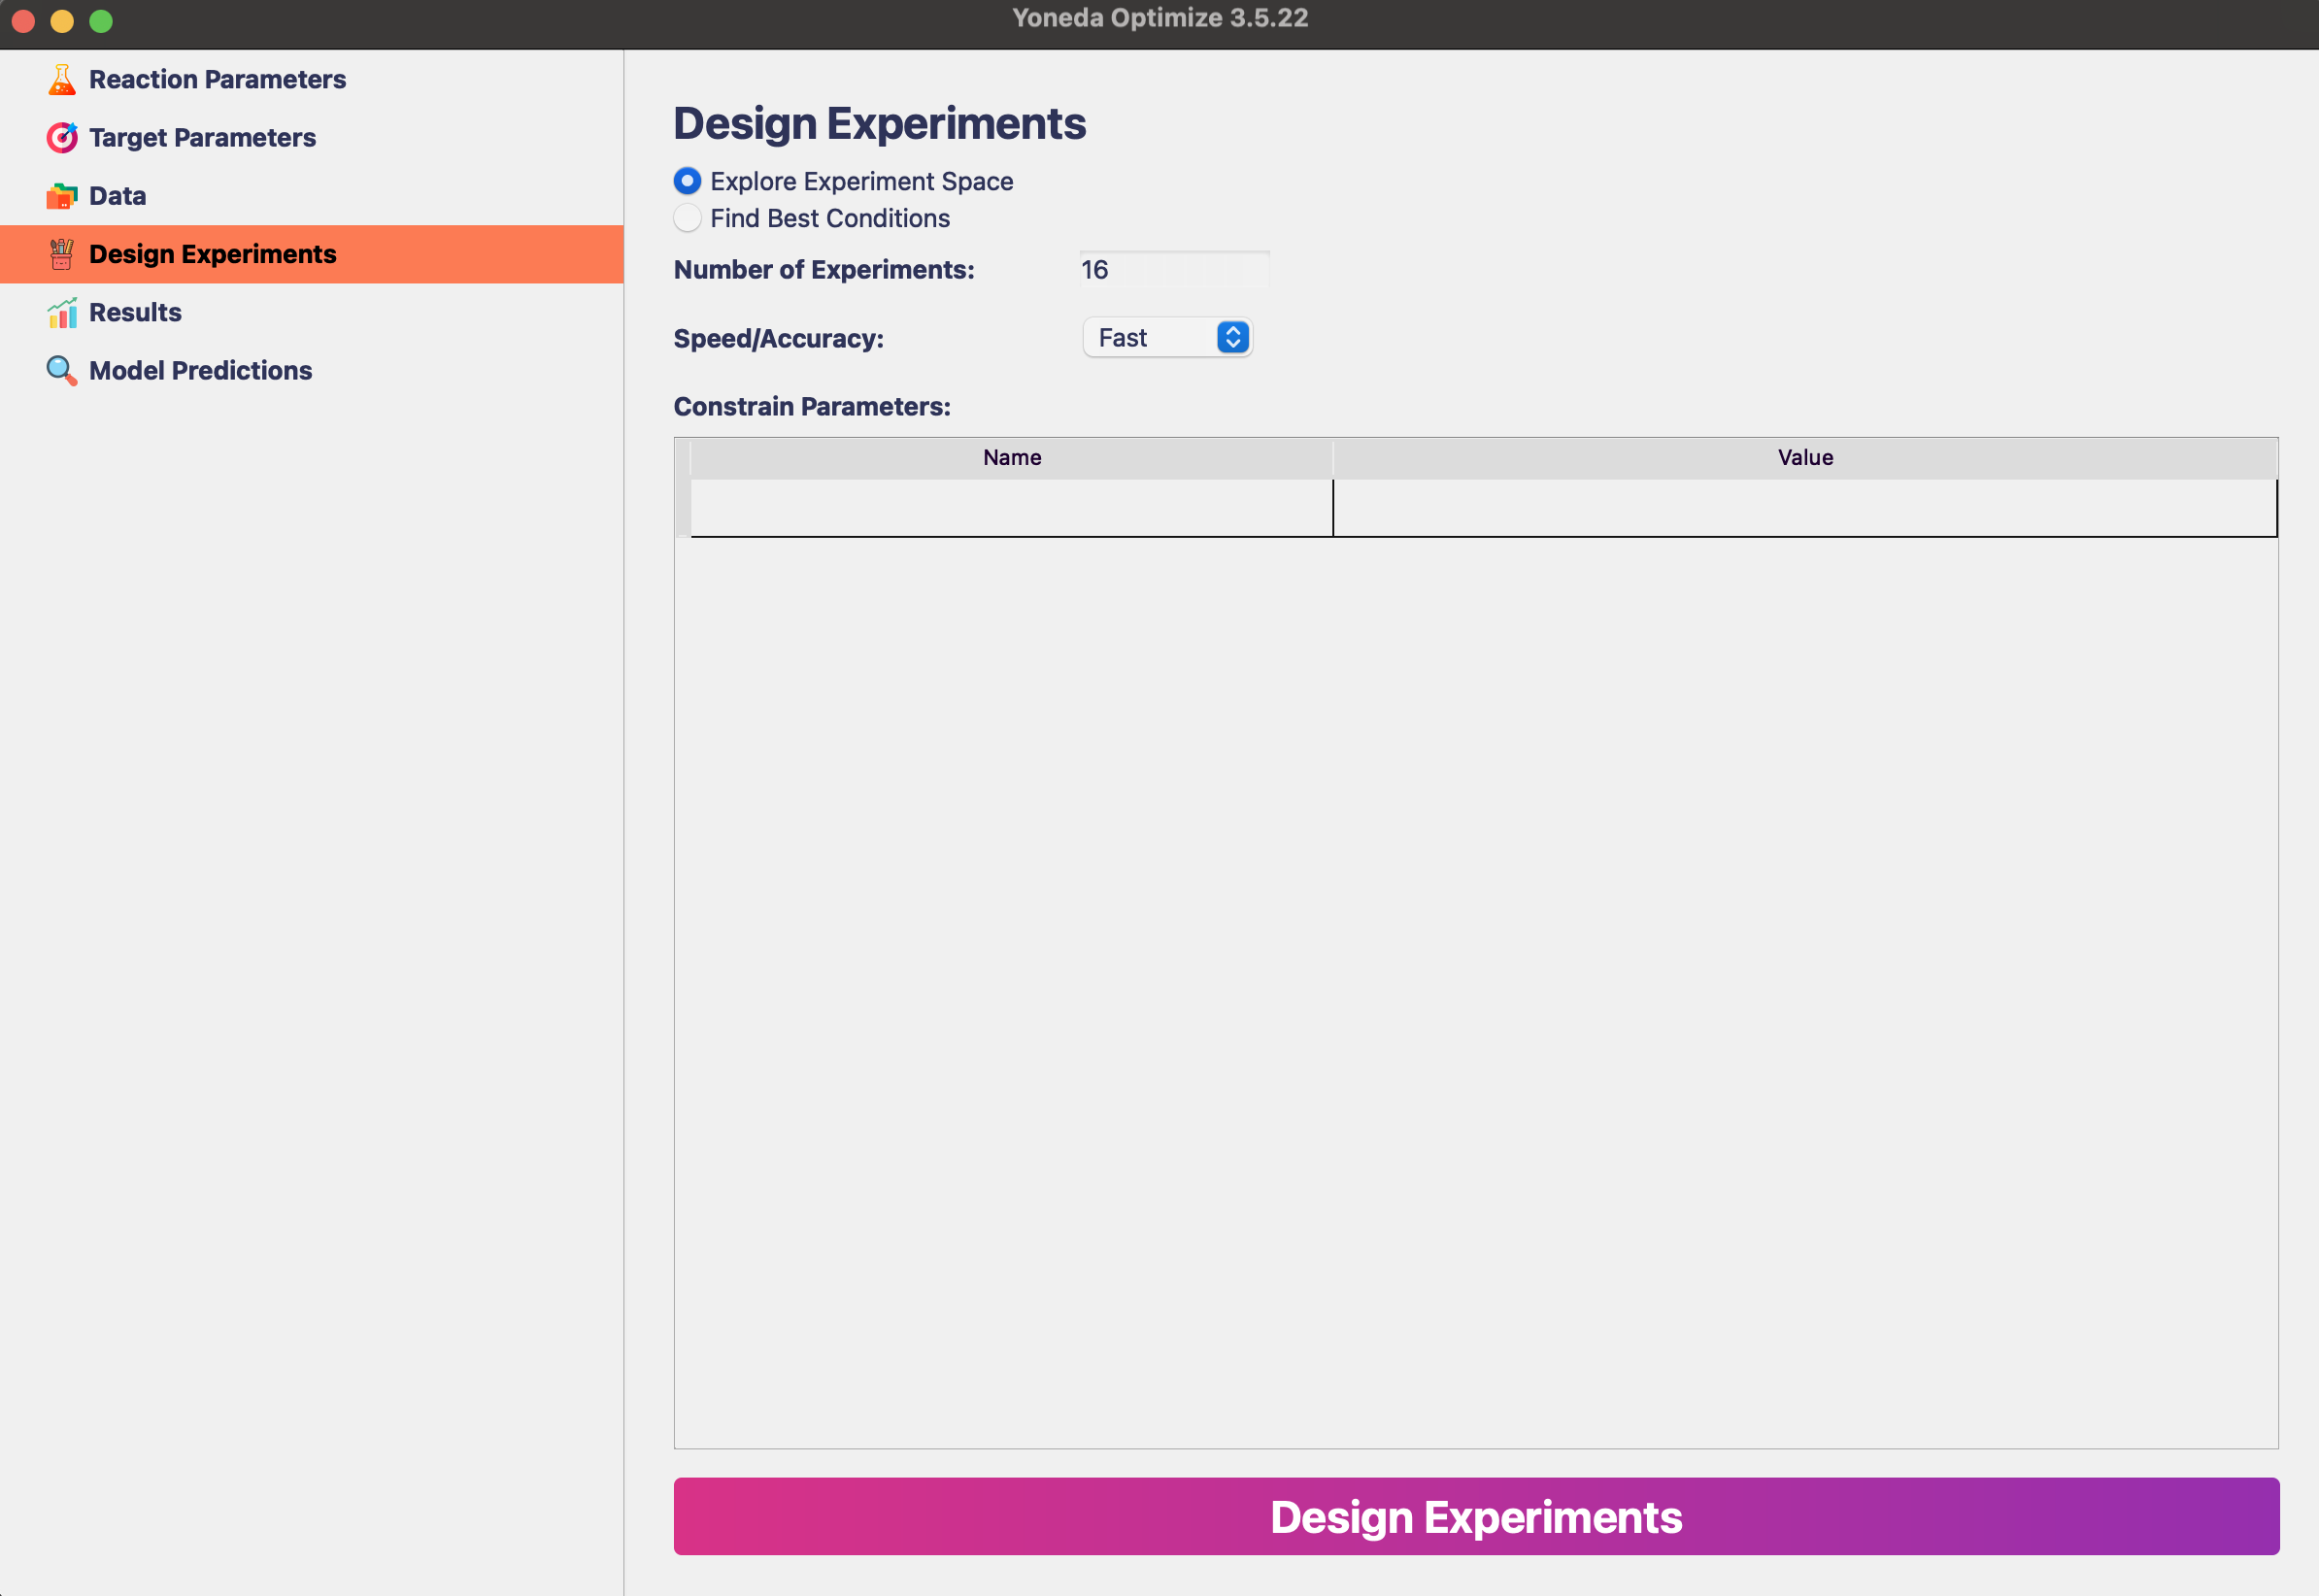
Assuming that we haven’t run any experiments yet, we want to start by exploring the reaction space using Design of Experiments. These experiments will help us understand the effect of different reaction parameters, and will be used to train the ML model later.
Tip
Selecting number of experiments can be tricky, it depends mostly on the size of reaction space that we defined as well as on the experimental setup. In this case 16 experiments is fine. Having 24 experiments would also work great, especially if the lab is set up to use 24-well plates.
Set Number of Experiments to 16. The Speed/Accuracy setting should be set to Balanced or Accurate, the Fast setting is only useful for very large reaction spaces.
Click Design Experiments and wait for the the algorithm to generate the experiments.
Note
Designing experiments can take a few minutes, depending on the size of the reaction space and number of reactions. Still, it is much faster than running the experiments in the lab!
Saving the Experiment Results
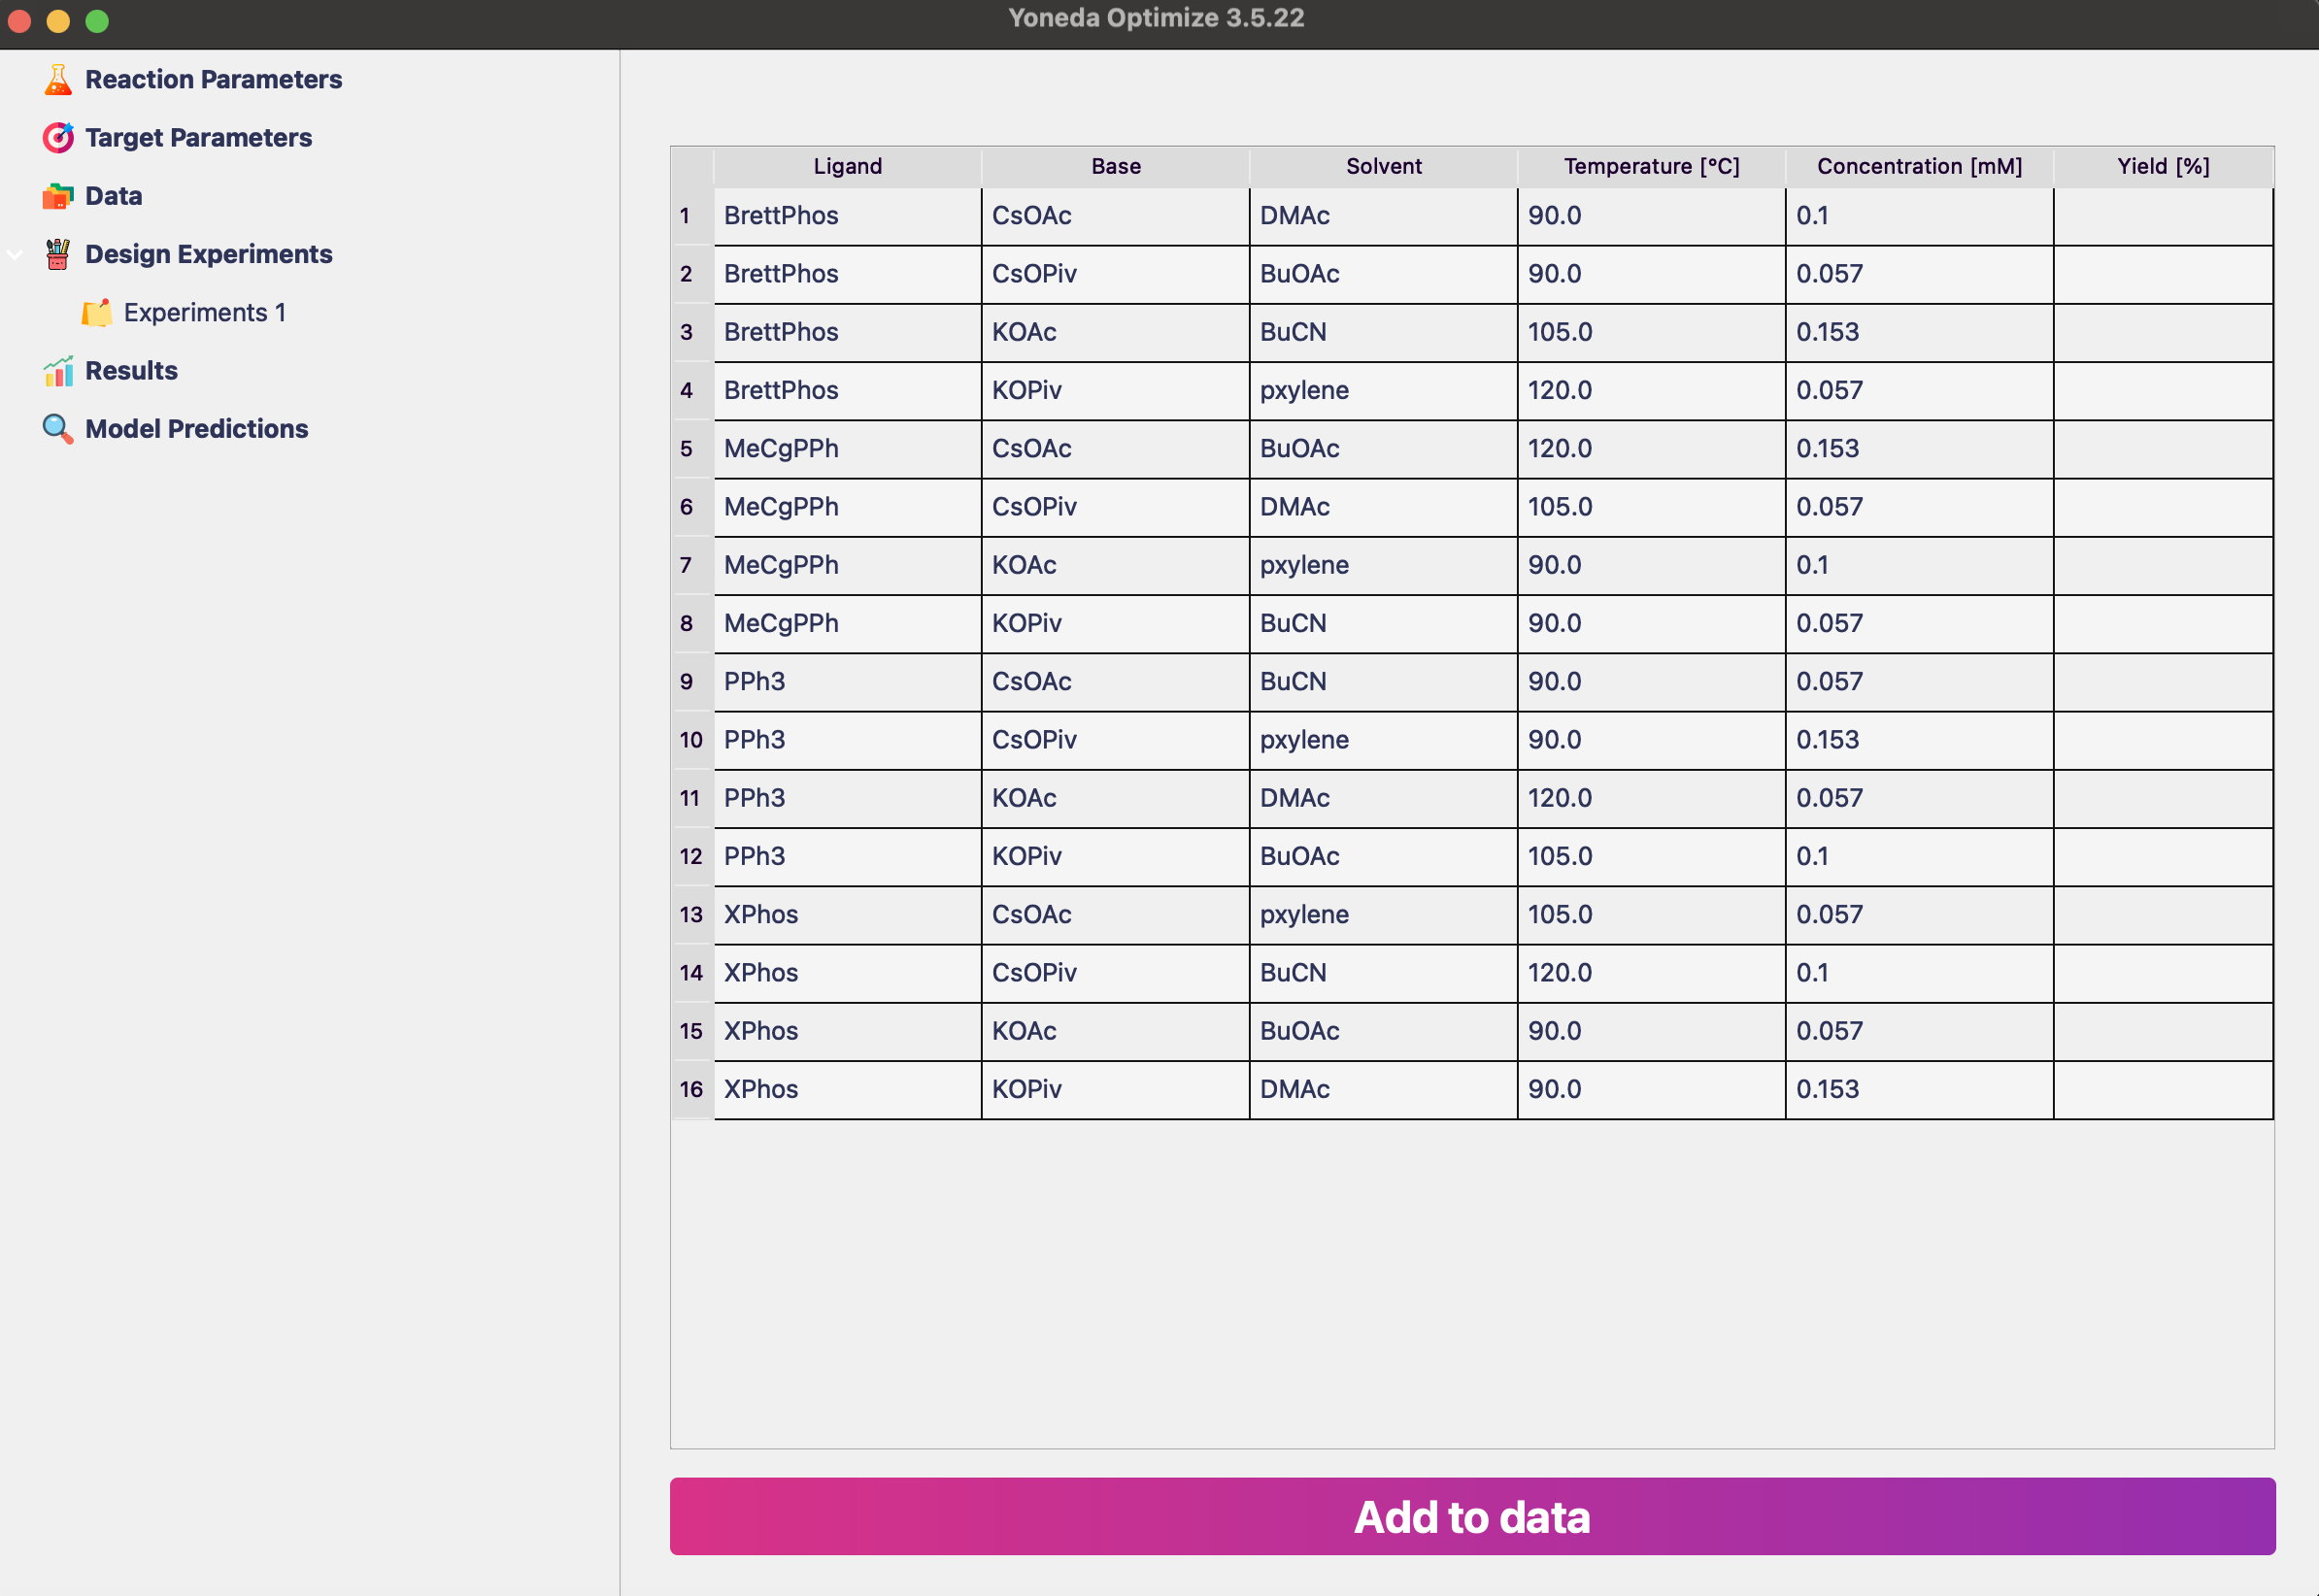
Once the experiments are generated, a table with the conditions will appear.
Warning
For most reaction spaces, there are multiple optimal experiment desings. The algorithm might generate differrent sets of experiments each time - this is normal and expected behavior.
When you follow the tutorial, you might get slightly different results than shown here.
Tip
As with any table in Yoneda Optimize, you can copy and paste values from Excel or any other software by selecting the cells and pressing Ctrl+C or Ctrl+V.
You can copy the table to Excel or any other software, and print it out to use in the lab. After running the experiments, fill in the Yield column. Click Add to data to save these experiments.
Note
The yields for this reaction have been published by the Doyle group and can be found on GitHub.
Inspecting the Results
To see summary of all experimental data, click Results in the sidebar. You will see a table showing best experiments and a configurable plot that lets you visualize trends in the reactivity.
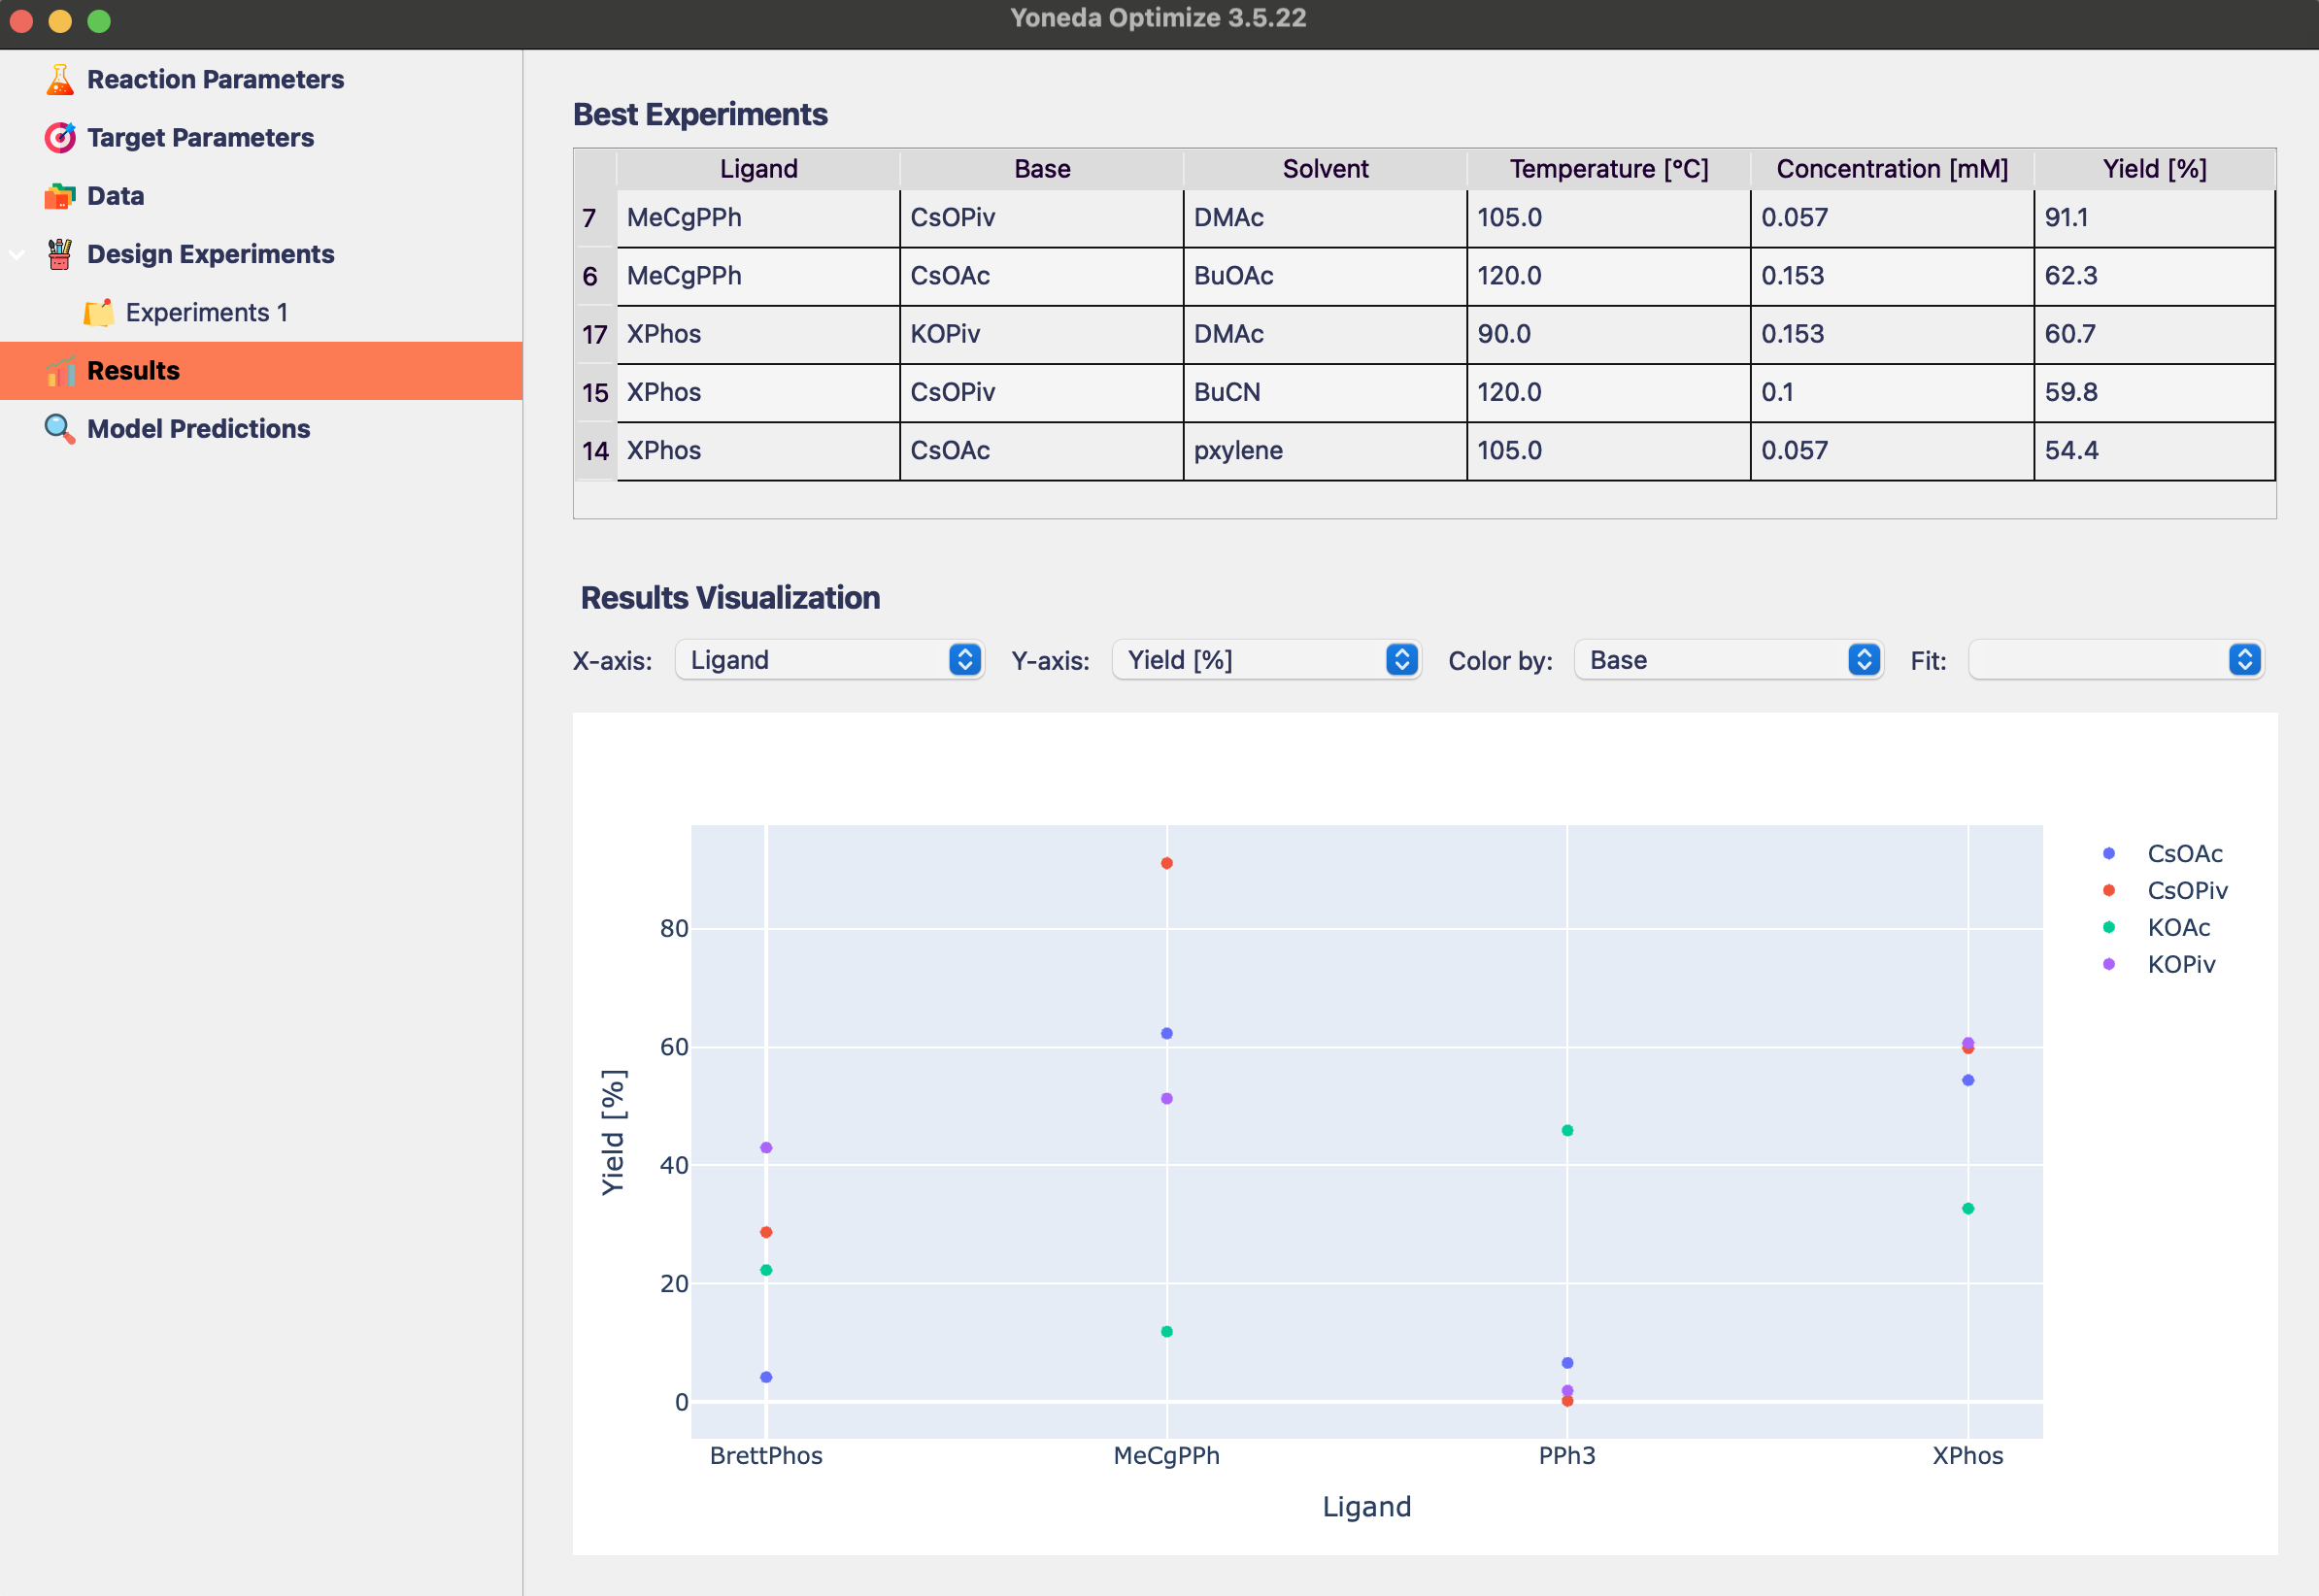
Try changing the plot to explore the relationship between yield and different parameters by selecting Yield [%] on Y-axis and any other parameter on X-axis. You can also color the points by selecting another parameter on Color by.
If you already have lots of data, it can be helpful to interpolate the results using th Interpolate dropdown.
Inspecting the Model Predictions
After you add your first data, the underlying AI model will be trained on it. You can click Model Predictions in the sidebar to view its predictions. You can visualise the changes in model’s prediction for up to two parameters at the same time while keeping the rest of the values fixed.

Above you can see the contour plot showing how the model changes its predictions based on the temperature and concentration of the reaction, when XPhos, KOPiv and DMAc are used as reagents.
Finding the Best Conditions
Now that we have some experimental data, we can use Bayesian Optimization to find the best reaction conditions. Click Design Experiments in the sidebar.
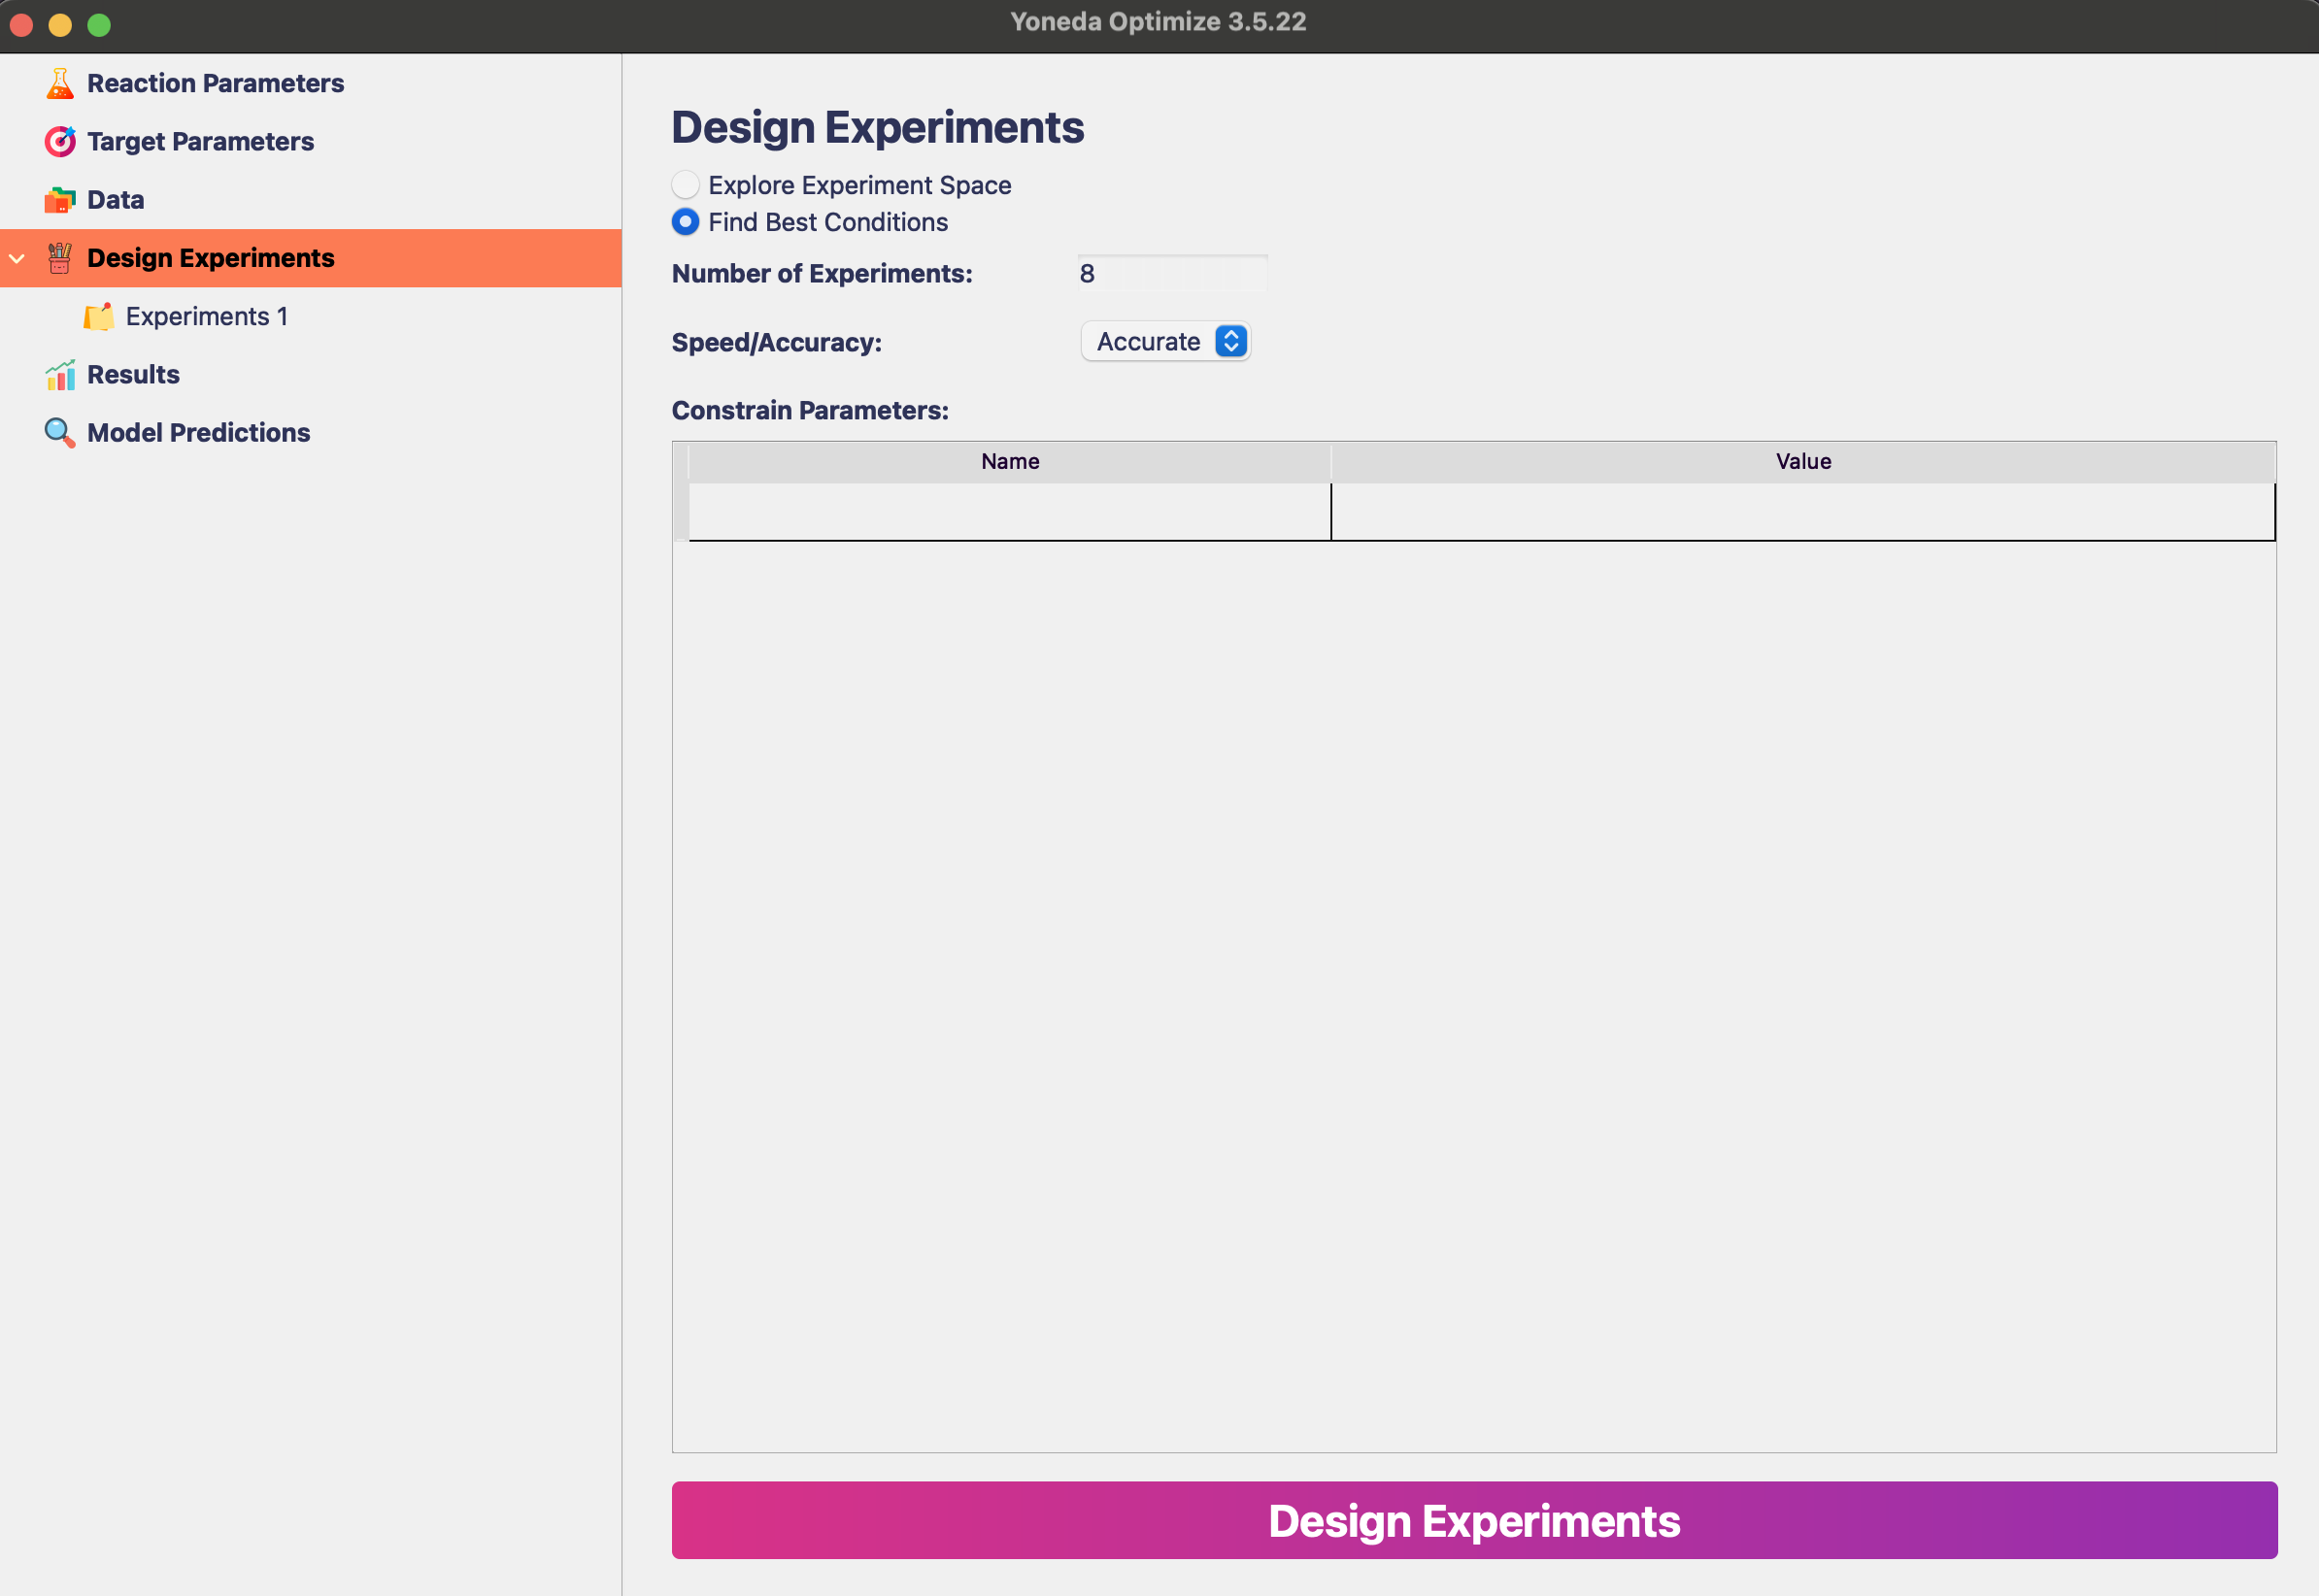
Similarly to running Design of Experiments, specify the number of experiments and the speed/accuracy setting.
Bayesian Optimization usually requires less experiments that the initial Design of Experiments, so we can set Number of Experiments to 8. The Speed/Accuracy setting should be set to Accurate.
Tip
If you already want to exclude some reactants, run all reactions at the same temperature, or constrain the search in any other way, you can use the Constrain Parameters option as described here.
After clicking Design Experiments, the algorithm will generate the experiments and show them in a table.
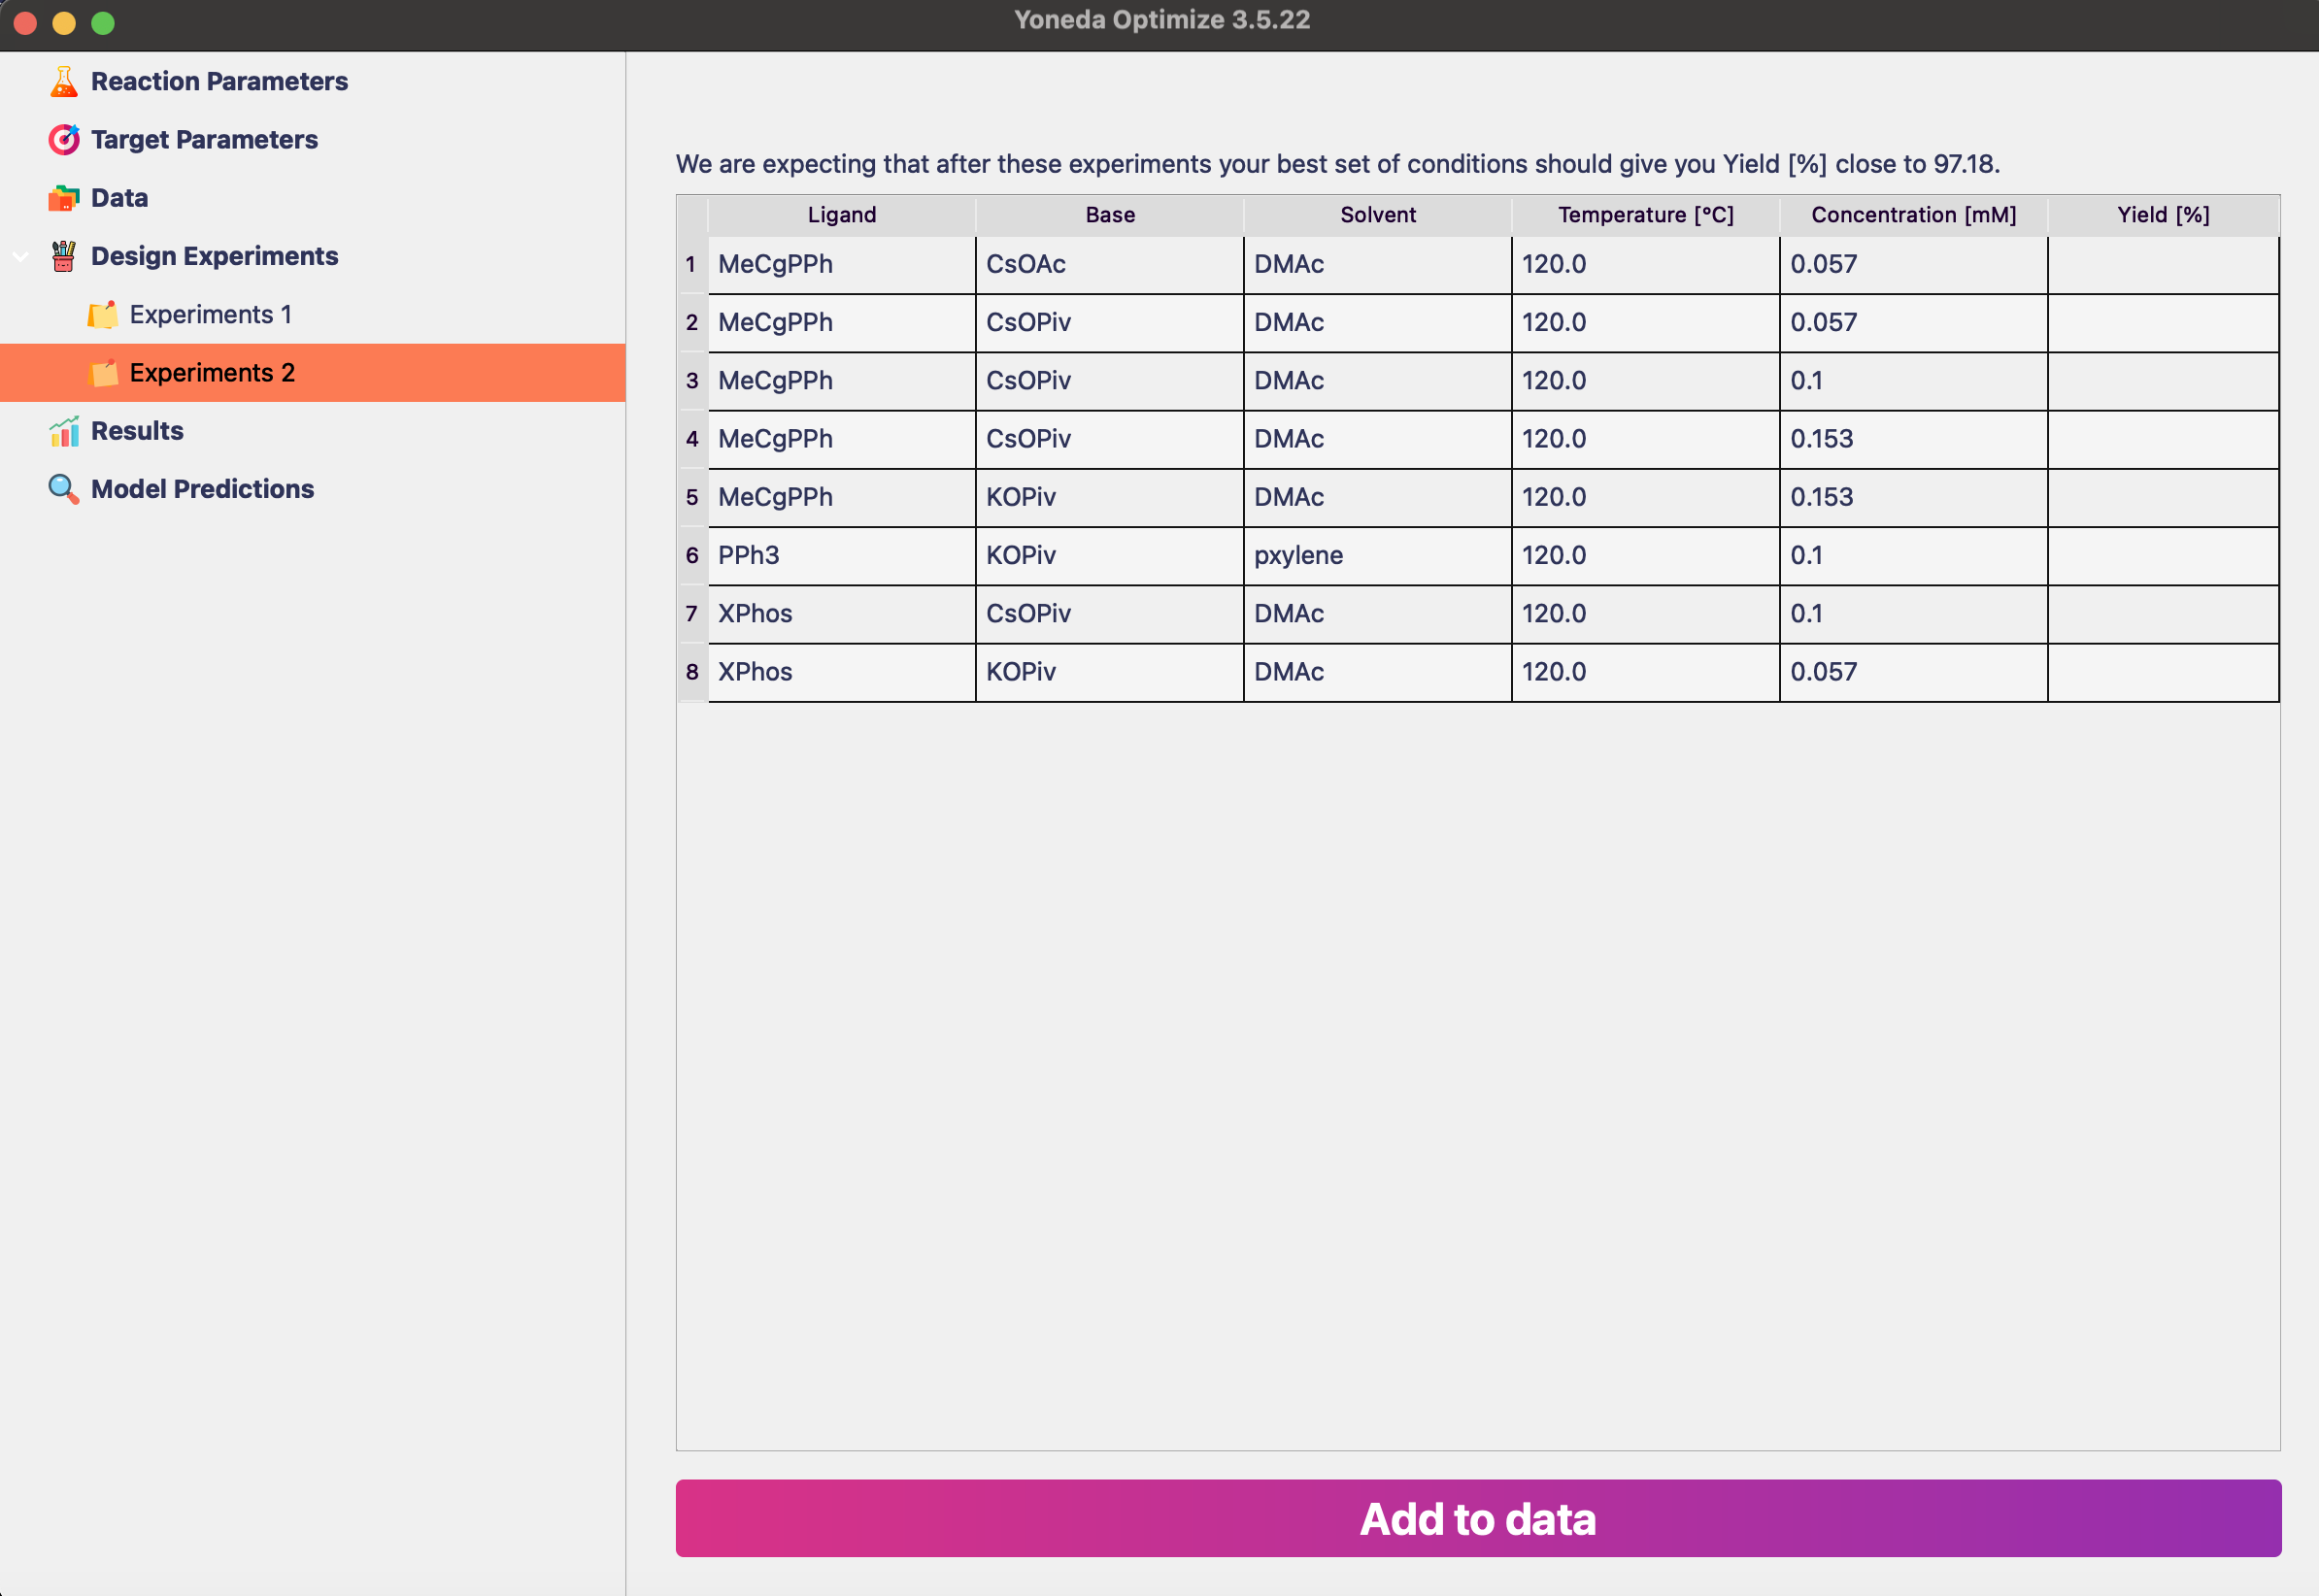
Again, you would run these experiments in the lab and paste the results into the table.
Let’s see how the results changed! Click Results in the sidebar.
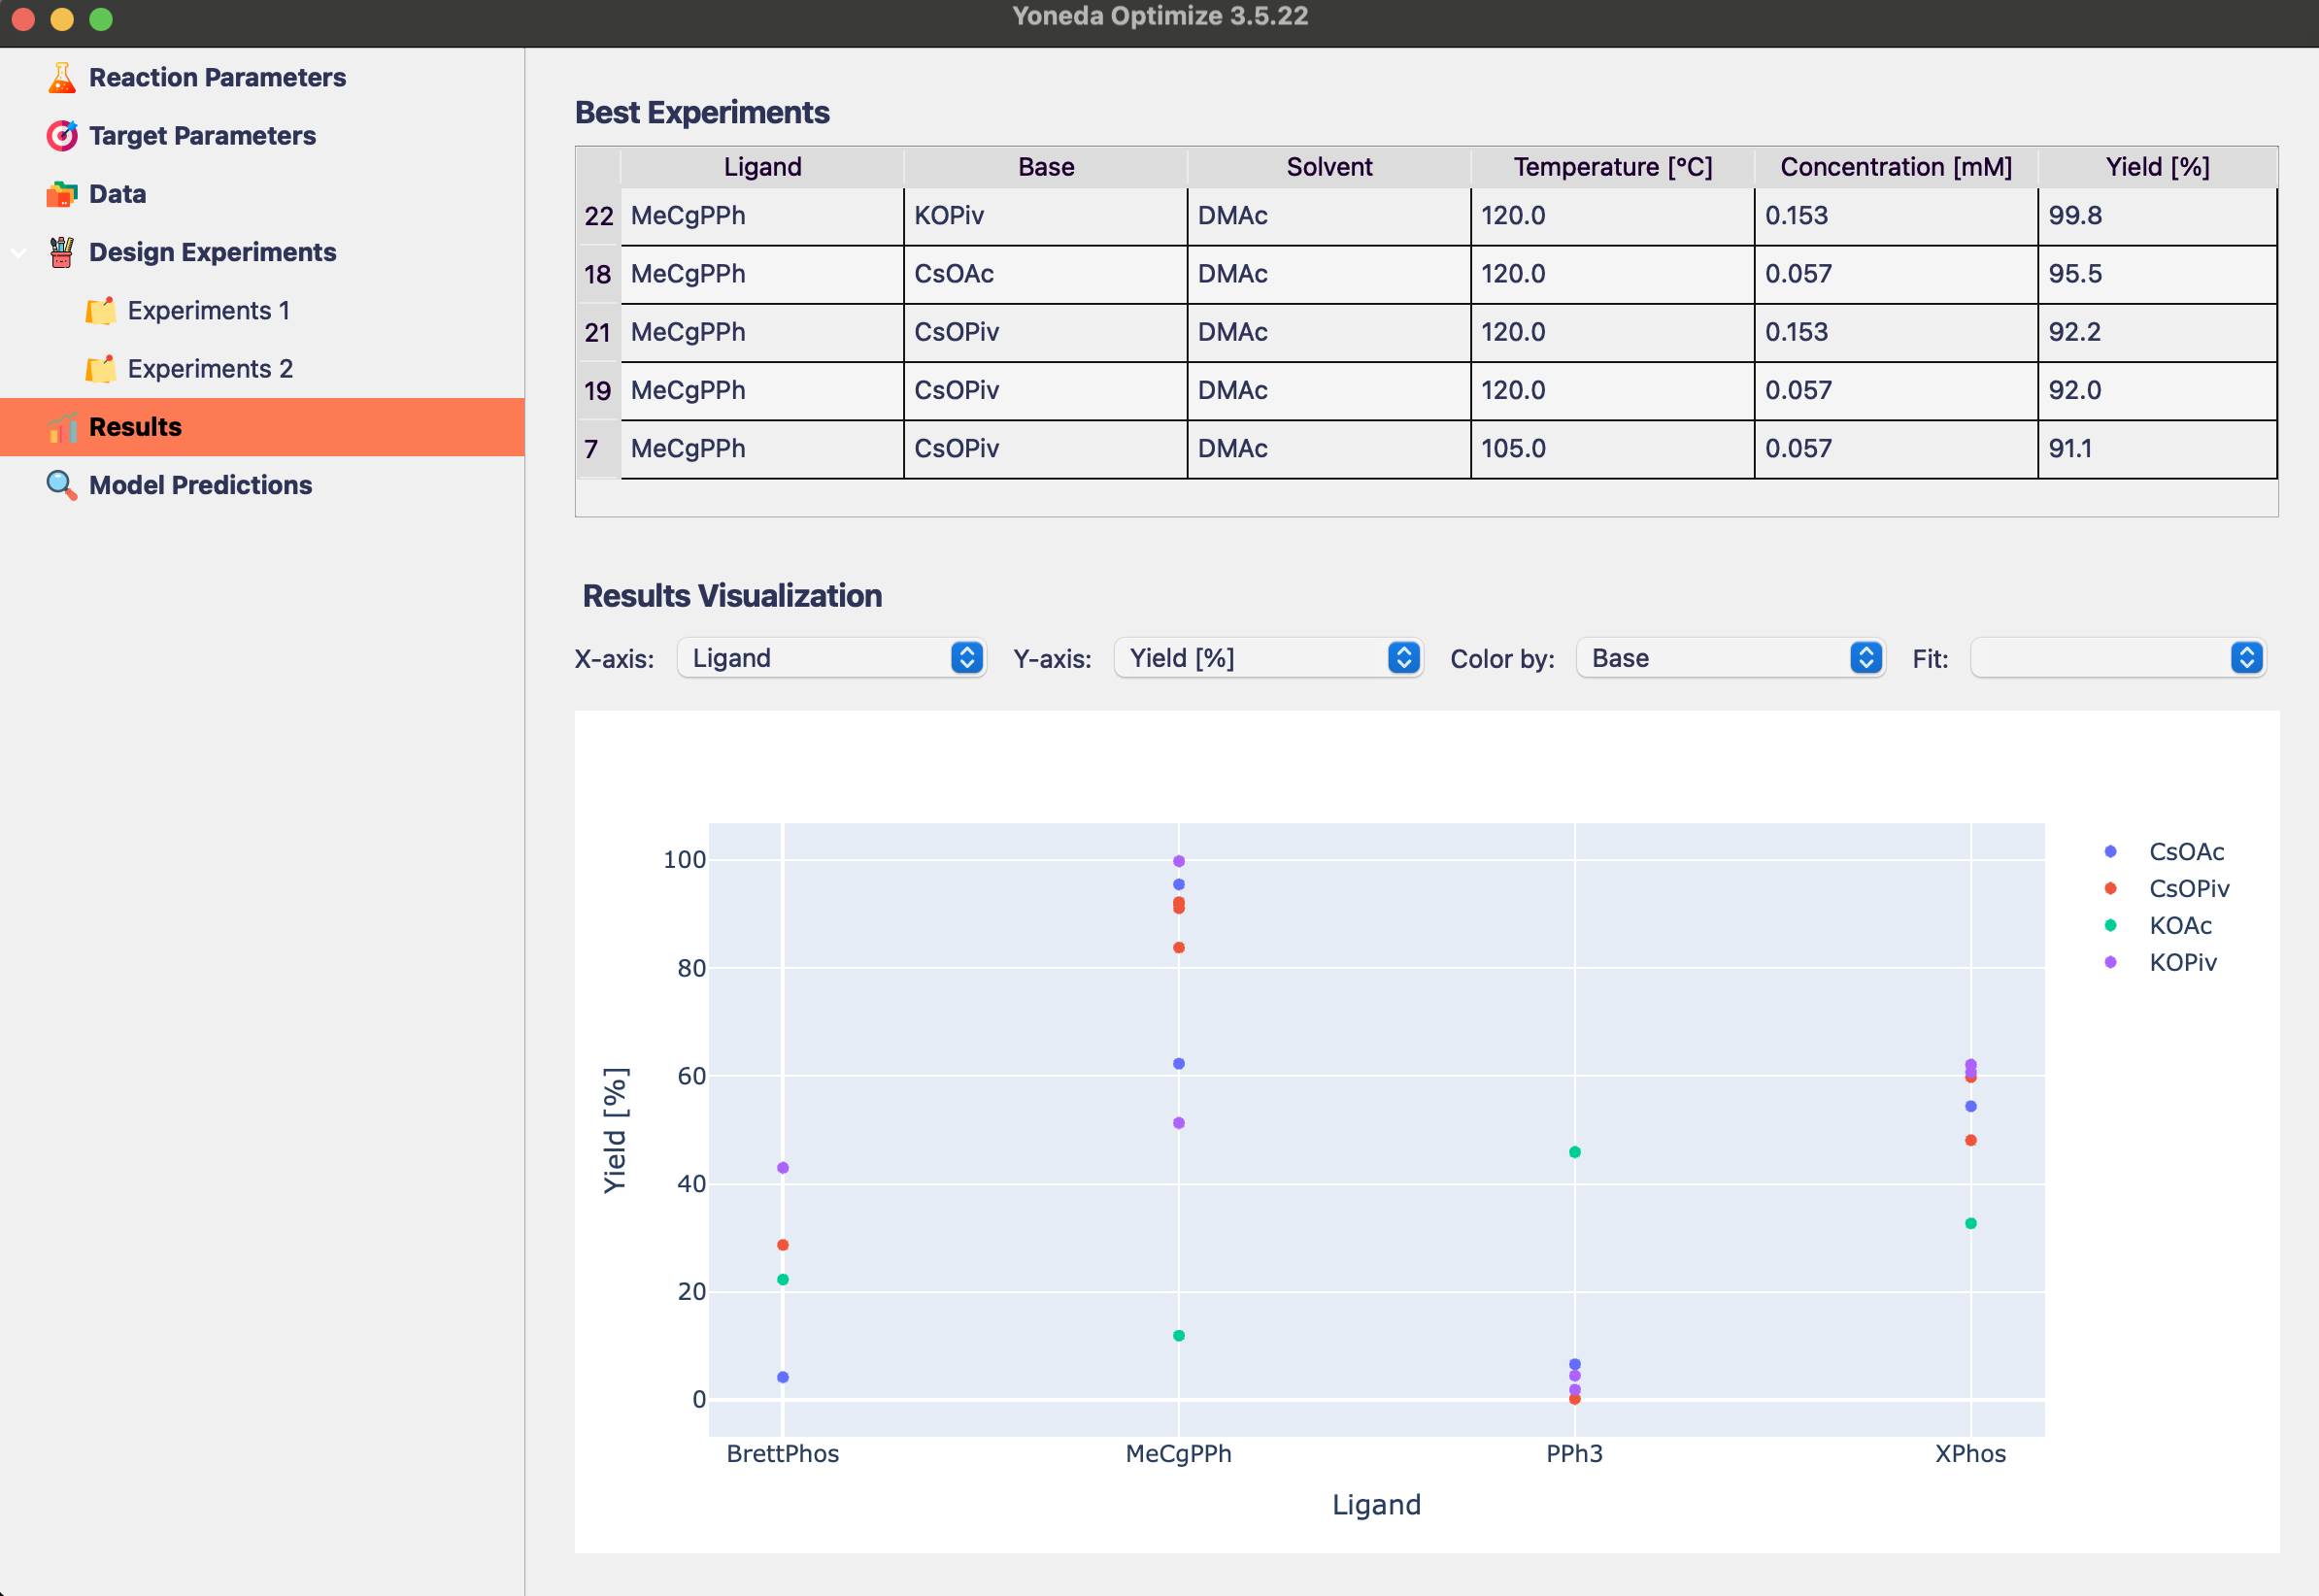
The algoritm found reaction conditions with 99.8% yield!
Wrap-up
Congratulations, you have successfully optimized your first reaction using Yoneda Optimize! Using only 24 experiments, we were able to find the best conditions in the reaction space of 500+ experiments.
The algorithms in Yoneda Optimize let you explore large reaction spaces much faster than traditional methods, and reliably find the best conditions for your reaction.
To learn more about all the features of Yoneda Optimize, you can refer to the detailed sections in the sidebar.
Happy optimizing!